
Sonic (formerly FTM) price increased by 1.8% in the last 24 hours, with trading volume up 500% to $114 million. Technical indicators such as the ADX and EMA lines suggest a strengthening uptrend, with the possibility of testing key resistance levels if momentum maintains.
However, bearish signals from the BBTrend indicator indicate mixed conditions, suggesting that traders should remain cautious about a potential reversal.
Sonic ADX indicates continued strong uptrend
The Sonic Average Directional Index (ADX) is currently at 35.6, a substantial increase from 21.9 just two days ago. This increase indicates a strong and strengthening trend, as the ADX is now well above the 25 threshold, which typically signals a strong trend.
The recent formation of a golden cross adds further bullish confirmation, suggesting that Sonic is positioned to extend its current uptrend.
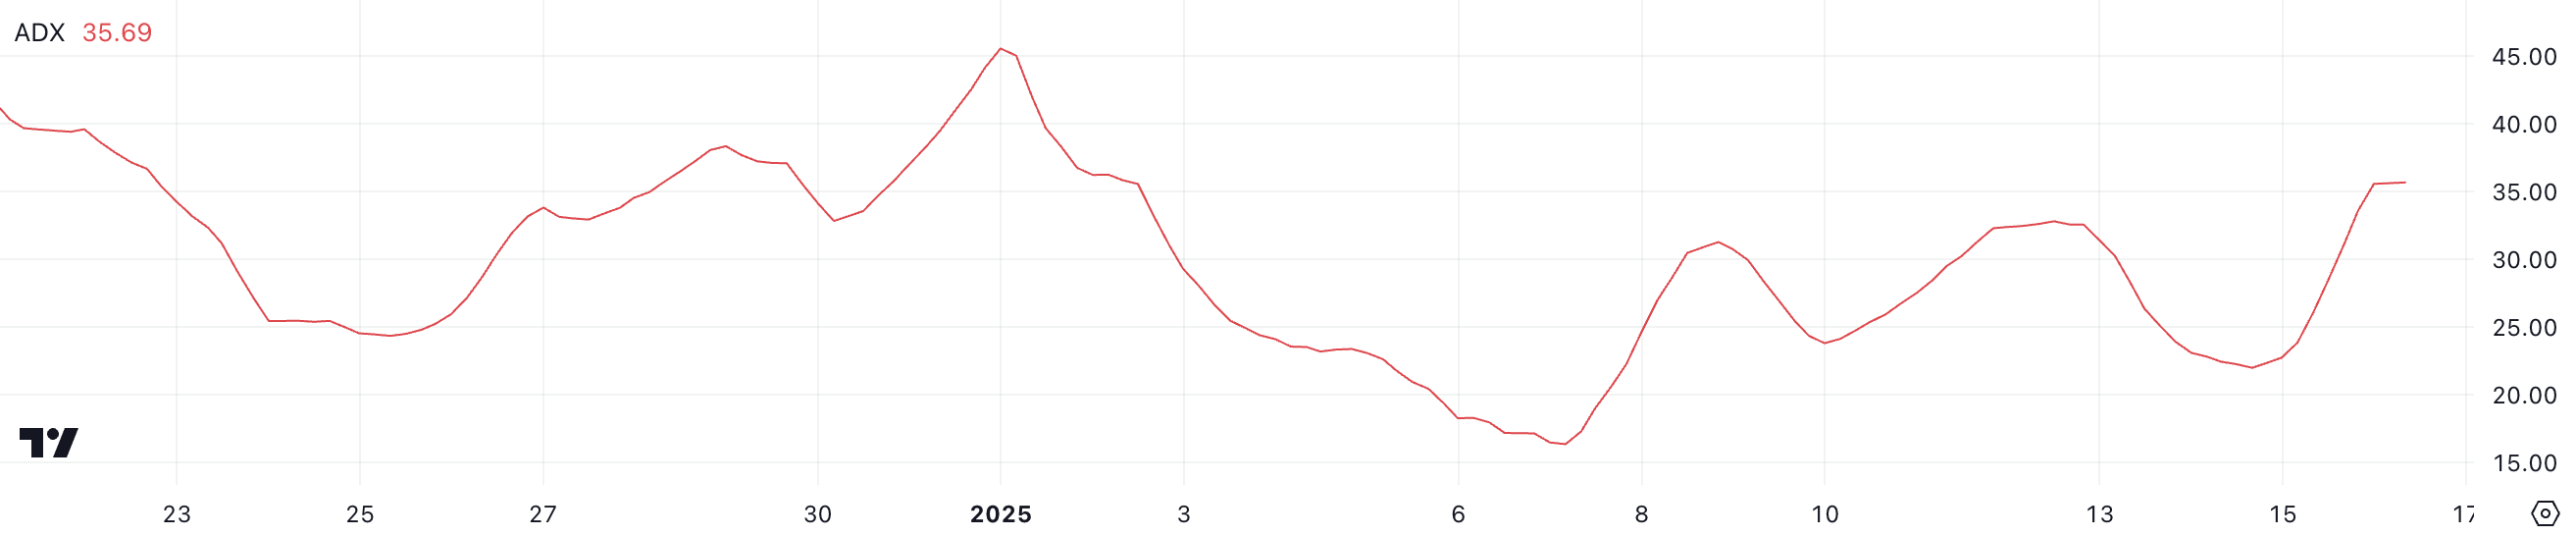
The ADX measures the strength of a trend, with values below 20 indicating weak or range-limited conditions and values above 25 indicating a strong, defined trend. At 35.6, Sonic ADX reflects solid momentum, supporting its continued upward trajectory.
This level of trend strength, combined with the golden cross, suggests that Sonic could see further price increases if buying pressure persists. However, any ADX block could indicate slowing momentum, potentially leading to consolidation or a pullback.
Sonic BBTrend is down
Sonic BBTrend is currently at -6.8, down significantly from -2.4 just a few hours ago. This sharp decline suggests increasing bearish pressure and a move away from potential bullish conditions, indicating a weakening trend in Sonic price action.
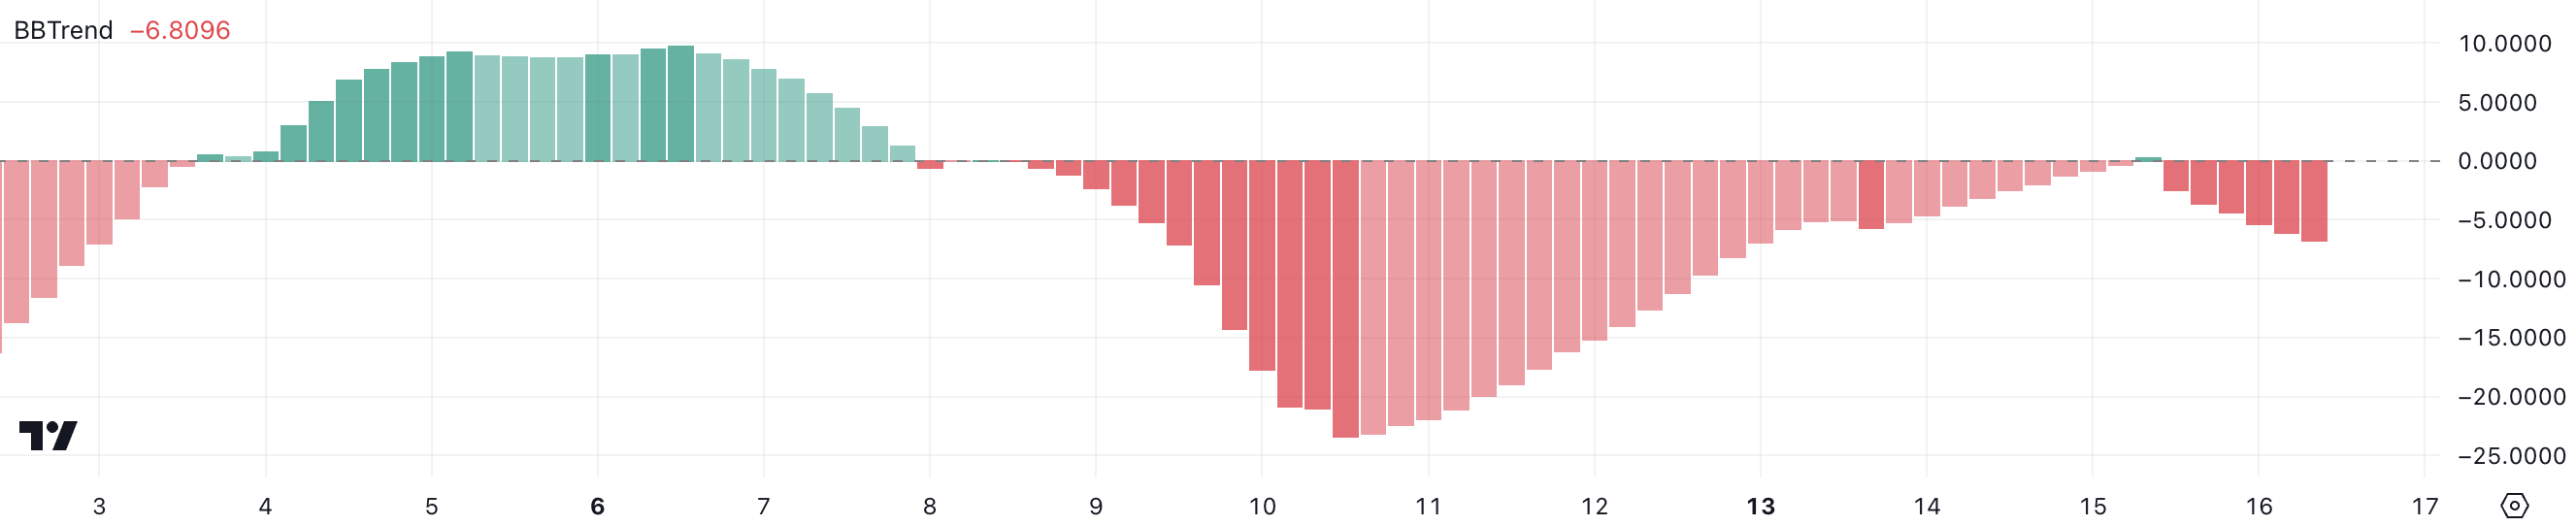
BBTrend is a technical indicator derived from Bollinger Bands, used to measure the strength and direction of a trend. Negative values indicate bearish conditions, while positive values reflect bullish momentum. Sonic’s BBT trend at -6.8 signals increasing bearish dominance, suggesting that Sonic may face downward pressure in the near term.
If the BBT trend remains negative or continues to decline, Sonic price could enter a stronger downtrend; however, a recovery towards positive values could signal a potential reversal.
Sonic Price Prediction: Can S Reach $1 in January?
The Sonic EMA lines show signs that a new golden cross could form soon, potentially signaling the continuation of its uptrend. If this bullish crossover occurs, Sonic could test resistance at $0.87, a critical level for price momentum.
A break above $0.87 could allow Sonic price to climb further and test $1.06, representing a potential 34% upside from current levels.
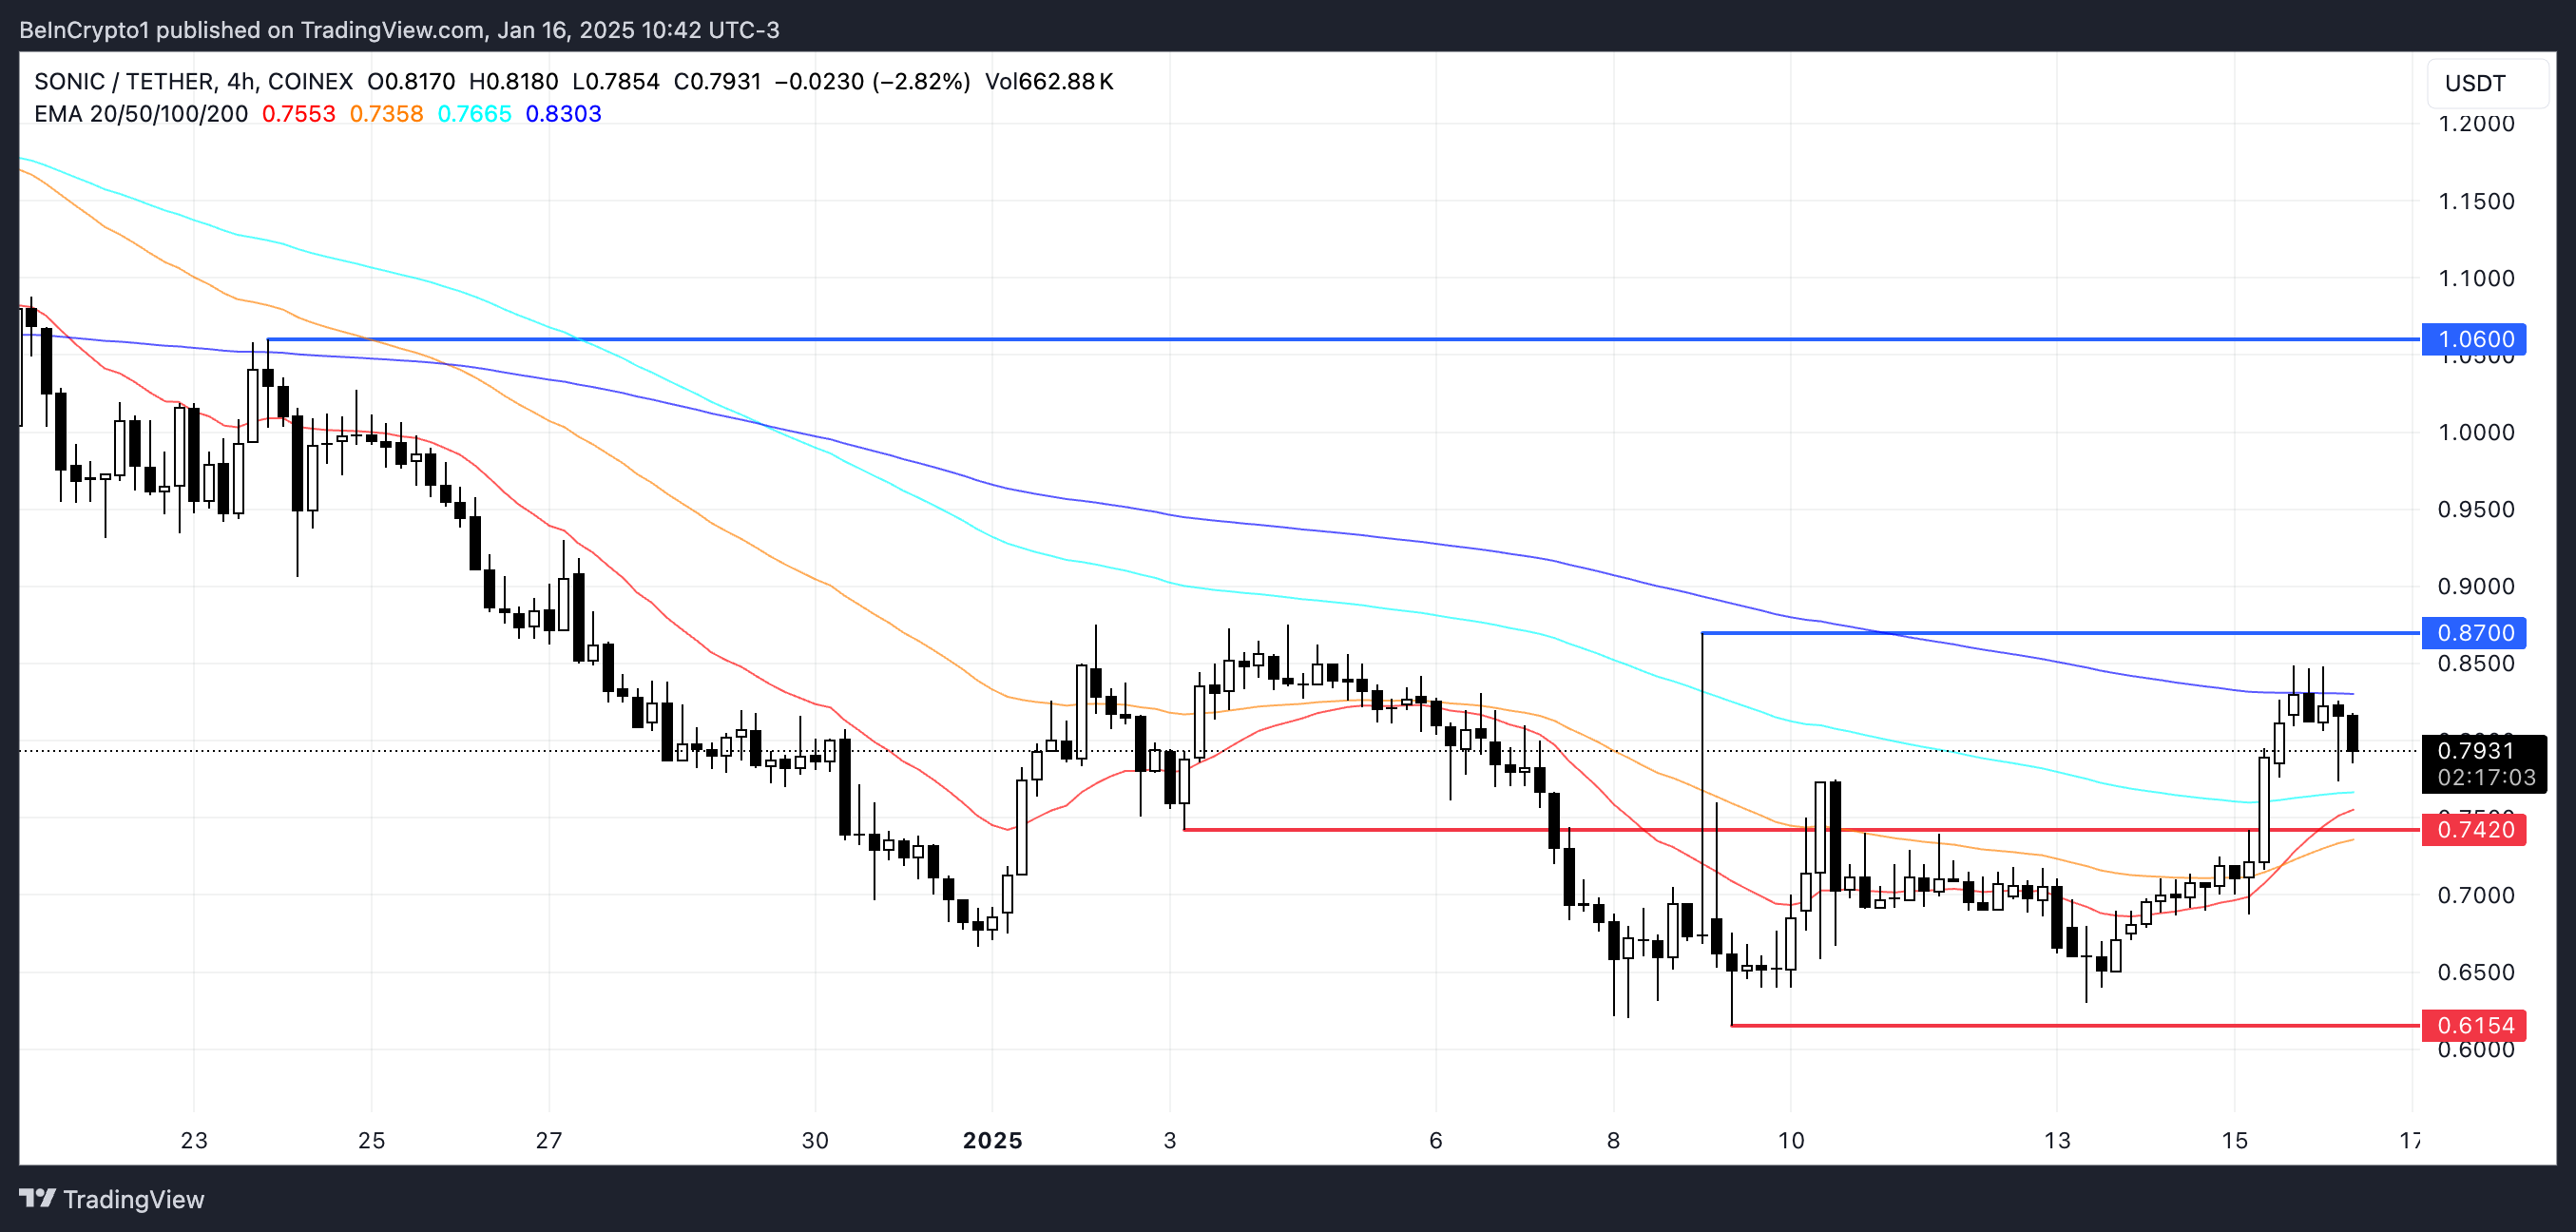
On the other hand, the mixed signals from ADX and BBTrend suggest caution, as they could indicate a weakening of the trend or a possible reversal. If Sonic price fails to maintain its upward momentum, it could test the support at $0.74.
A break below this level would expose Sonic to further decline, potentially falling to $0.61 and signaling a move into a bearish phase.
Disclaimer
In accordance with Trust Project guidelines, this price analysis article is for informational purposes only and should not be considered financial or investment advice. BeInCrypto is committed to providing accurate and unbiased reporting, but market conditions are subject to change without notice. Always do your own research and consult a professional before making any financial decision. Please note that our Terms and Conditions, Privacy Policy and Disclaimer have been updated.


