
Ripple’s XRP has seen its price erode considerably in recent weeks following a meteoric rise of almost 500% between November 6 and December 3. Since hitting a multi-year high of $2.90 on December 3, the altcoin has been in a downtrend.
With bearish momentum strengthening, the cryptocurrency is poised to fall below the $2 support mark in the near term. This analysis explains why this can happen.
Ripple Token Sees Increase in Sales
An assessment of the XRP/USD single chart showed that since peaking at $2.90 on December 3, the cryptocurrency has remained trapped in a descending triangle, a bearish technical pattern.
This trend occurs when the price of an asset creates a series of lower highs while maintaining a horizontal support level. This pattern indicates increasing selling pressure and often signals a potential downside breakout if price falls below support.
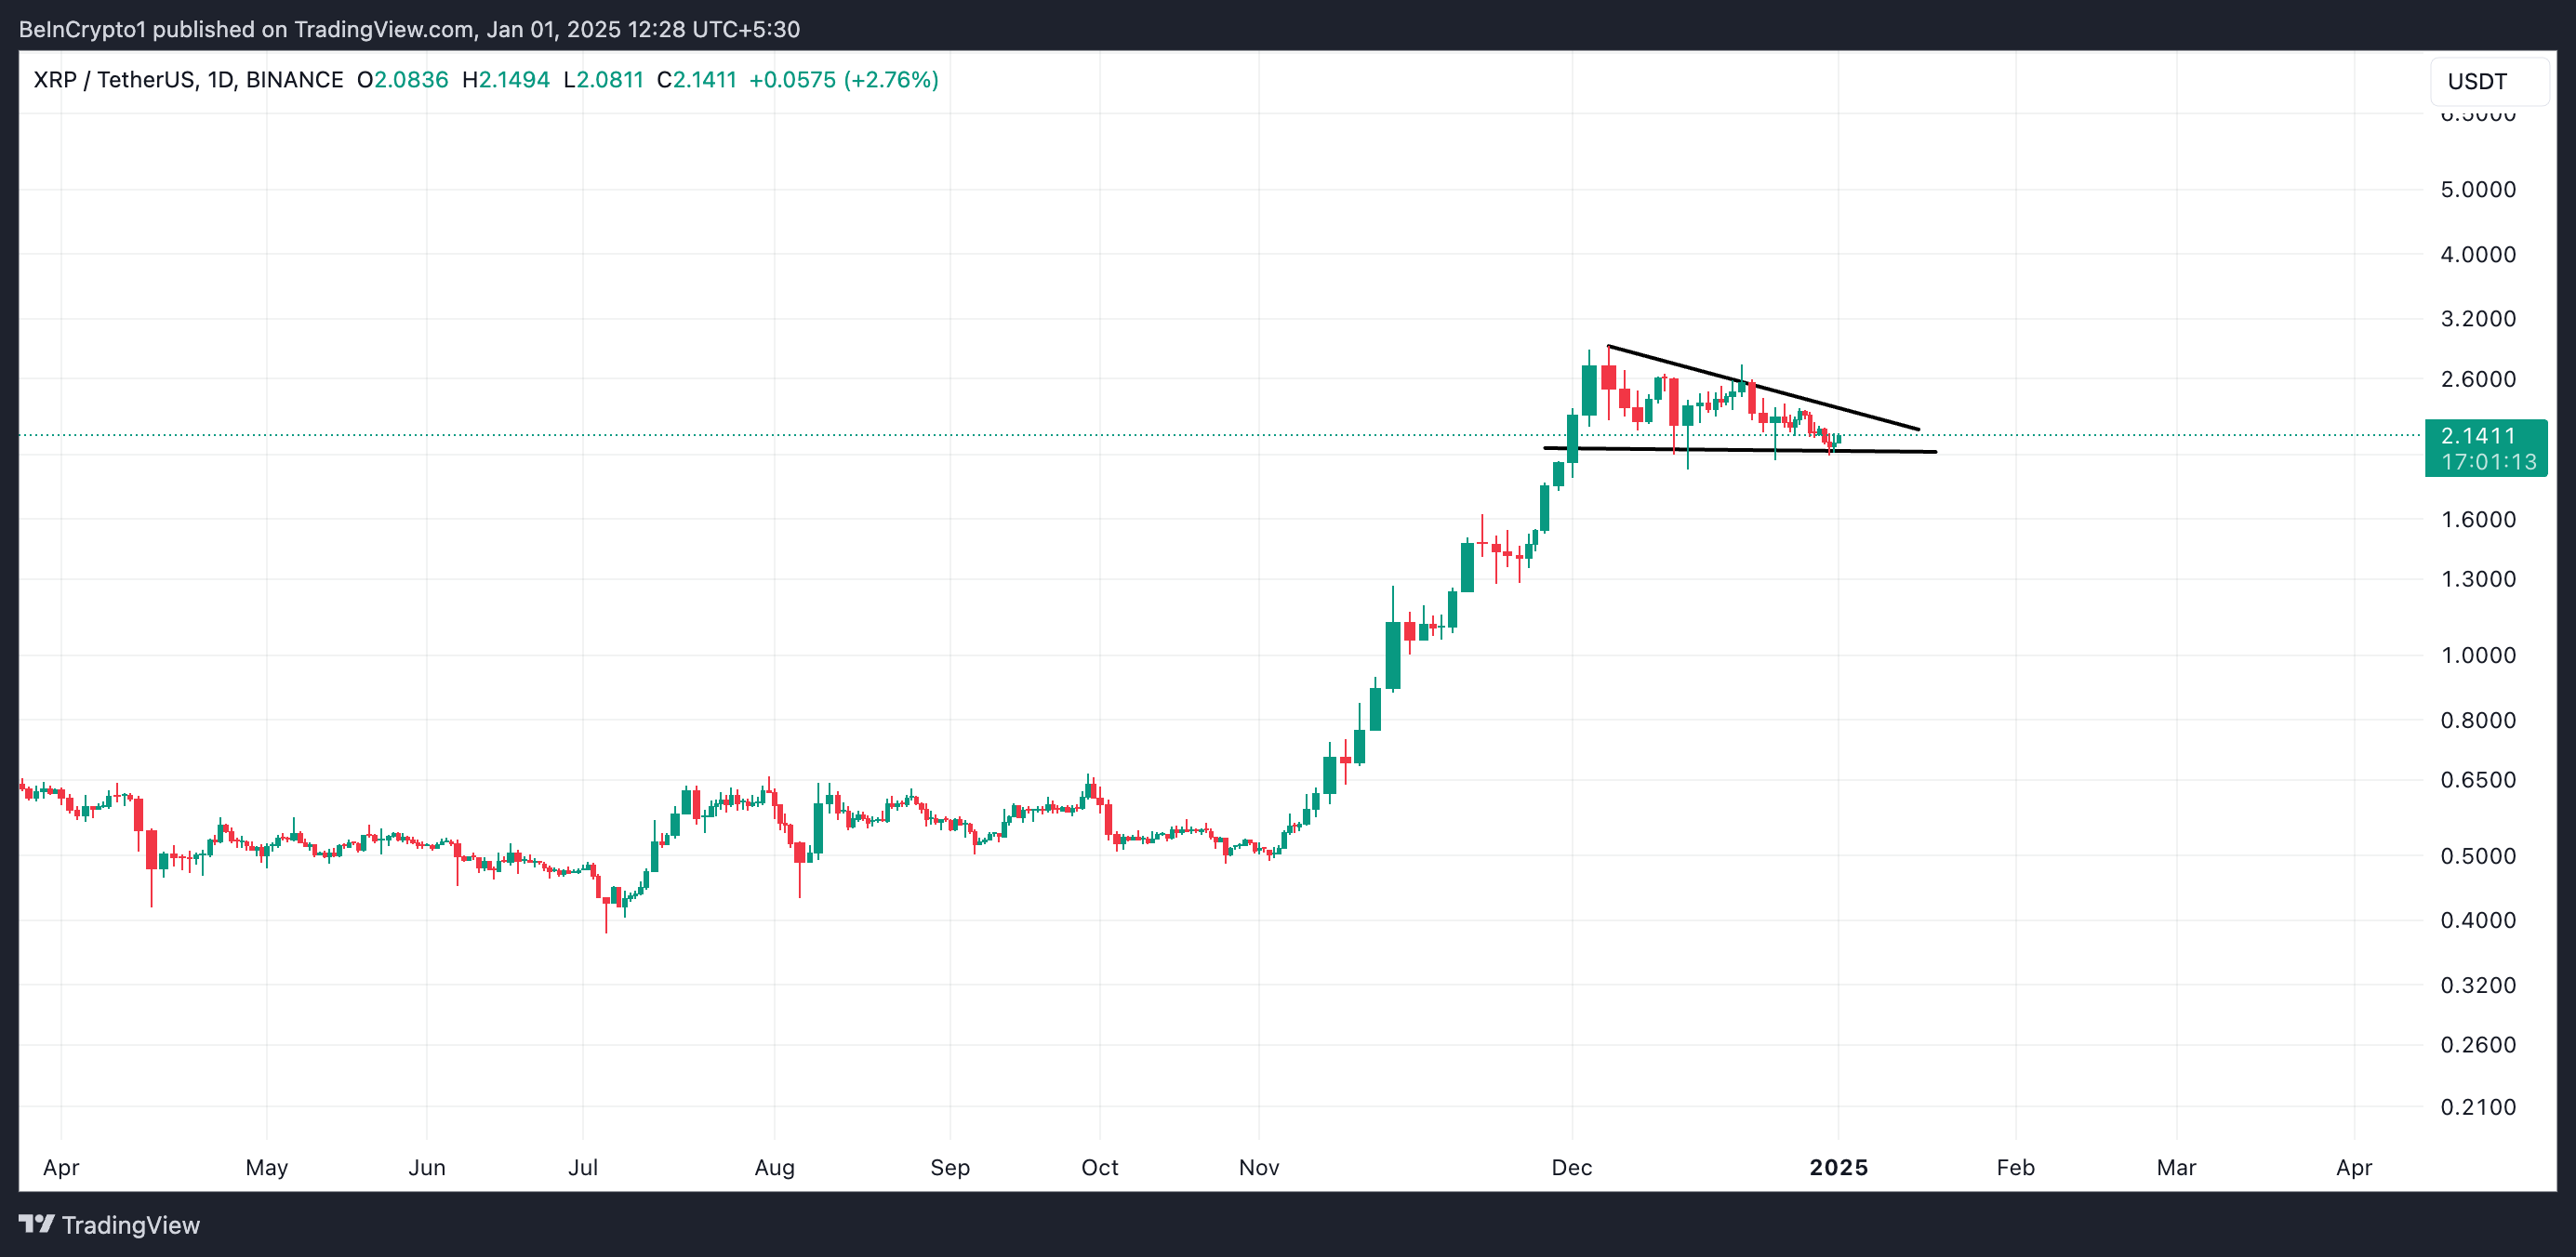
For XRP, this support is formed at the critical price level of $2. However, with selling pressure building, bulls may find it difficult to defend this price level at the moment. One of the reasons for this is the low accumulation of XRP whales in recent weeks.
According to Santiment, XRP whales controlling between 10,000,000 and 100,000,000 tokens have reduced their holdings by 350 million XRP since December 4. This means that during the reporting period, this cohort of XRP investors collectively sold tokens worth $746 million, contributing to the decline. pressure on its price.
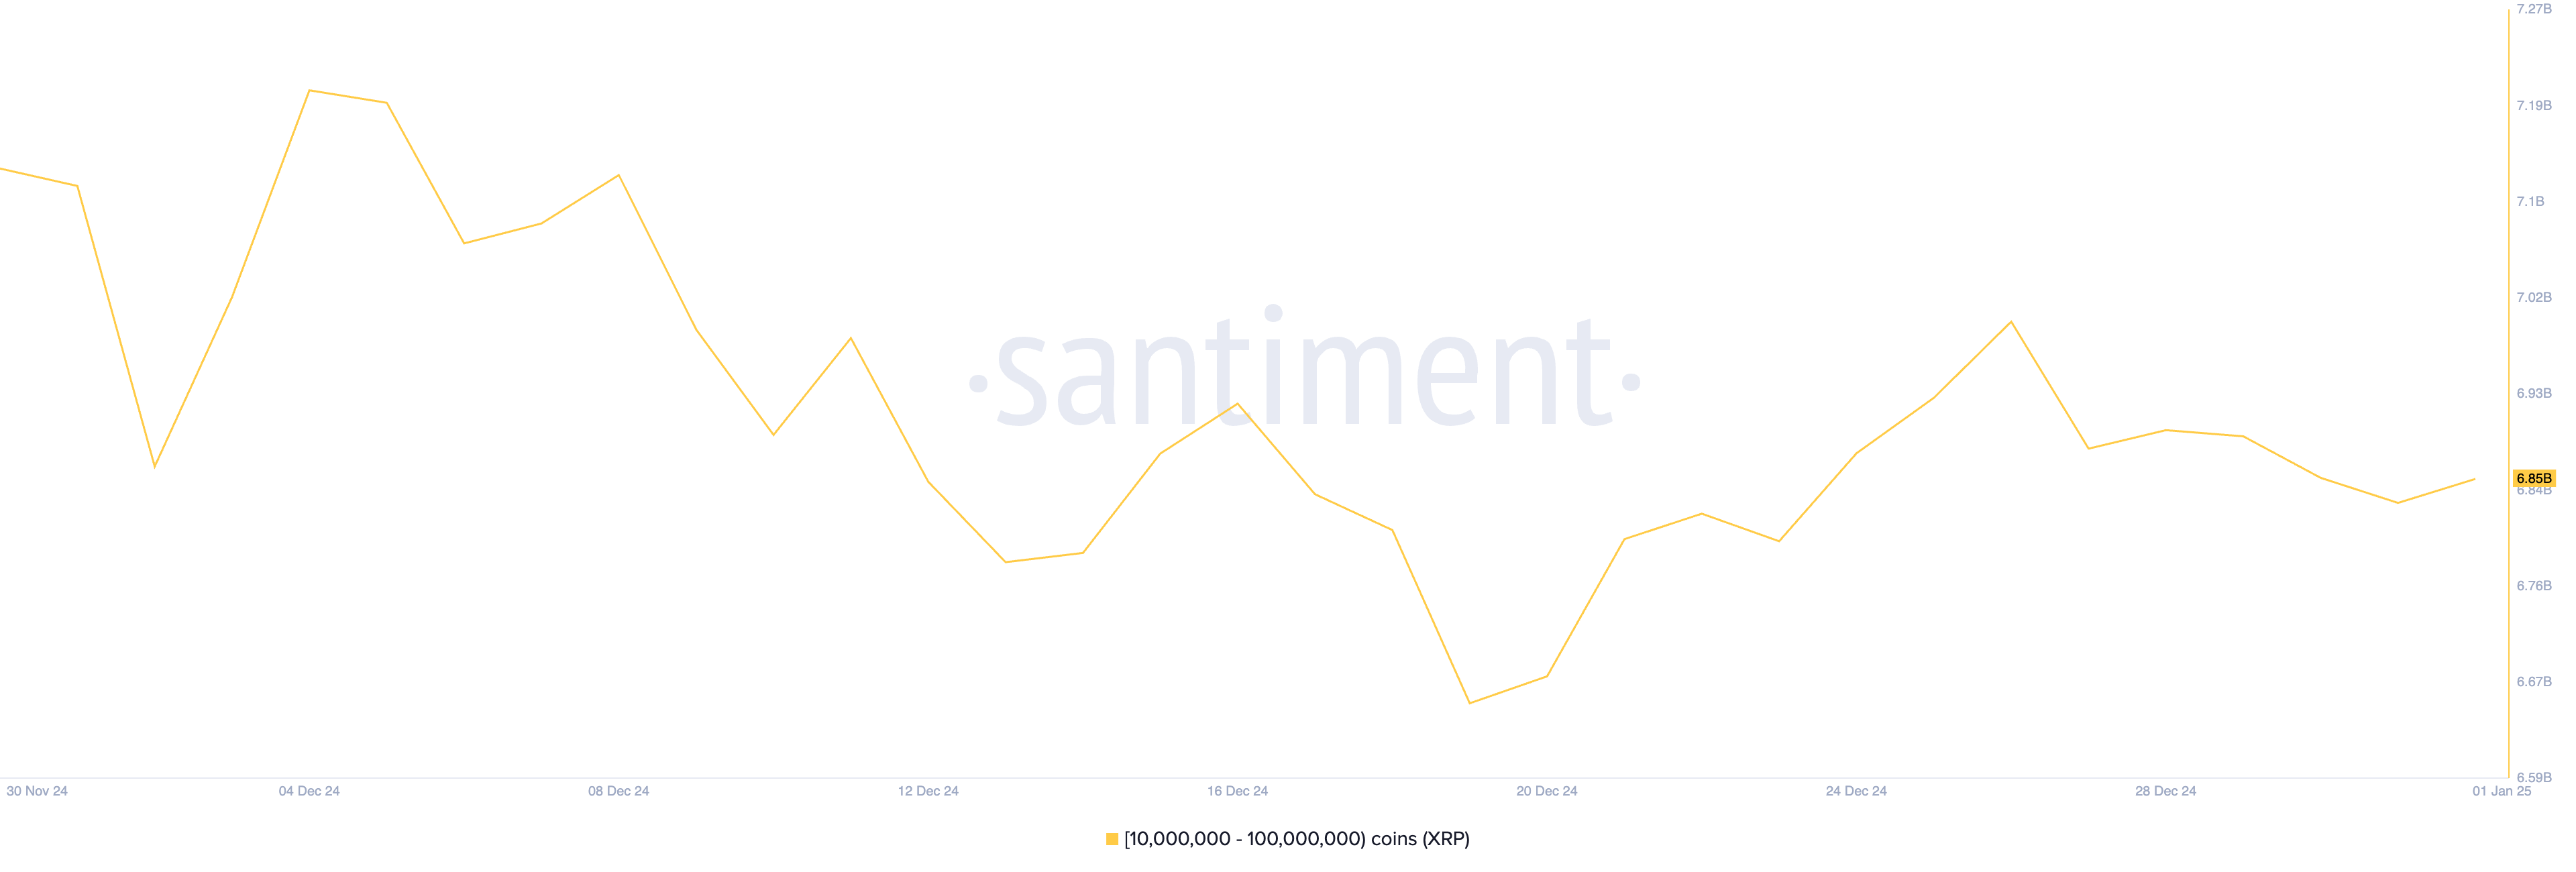
A reduction in whale accumulation is concerning because these large holders often ensure market stability by holding significant amounts of tokens. Their selling activity can trigger panic among small investors, worsening price declines and increasing market volatility.
XRP Price Prediction: Will $2 Hold?
On a daily chart, XRP is currently trading below its 20-day exponential moving average (EMA), which calculates the average price of an asset over the past 20 days, giving more weight to recent prices to better capture short-term trends.
When an asset’s price falls below this key moving average, it confirms bearish sentiment, indicating a downtrend or increased selling pressure in the short term.
If the selling pressure builds, the XRP token price could fall below the $2 support offered by the lower line of its descending triangle. In this scenario, the token’s price would plunge to $1.88. If this level fails to hold, XRP price could fall further to $1.34.
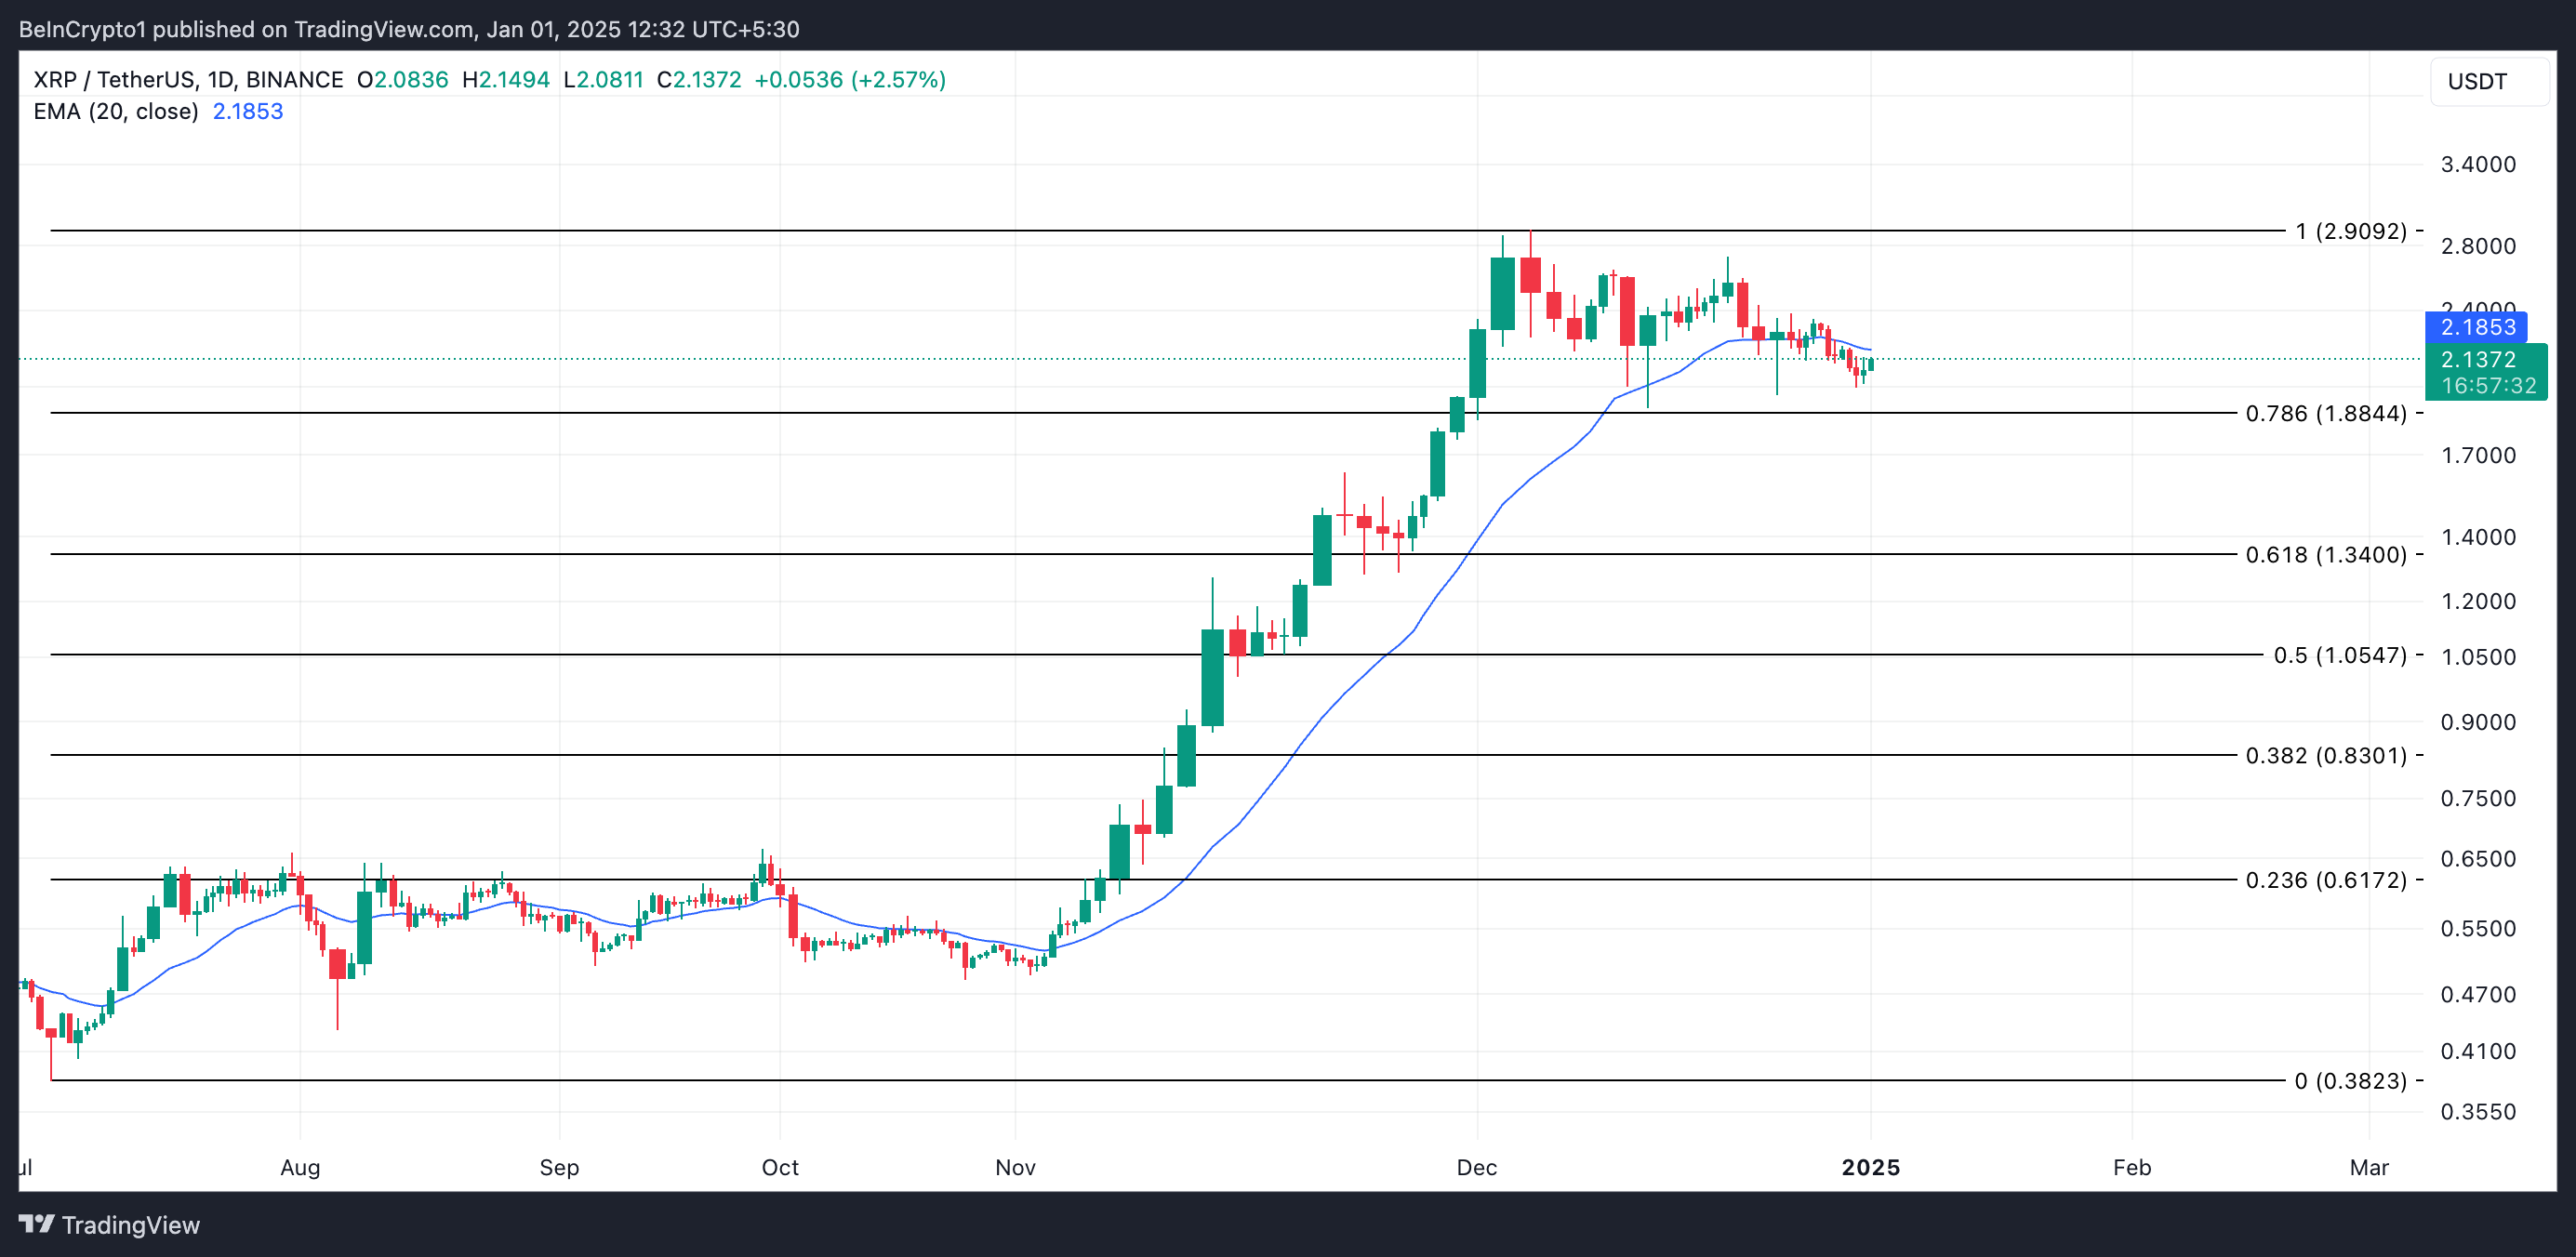
On the other hand, if sentiment shifts from bearish to bullish, XRP price will climb above its 20-day EMA, which provides a dynamic barrier or resistance at $2.18. A successful breakout above this level could propel the XRP token price to its multi-year high of $2.90.
Disclaimer
In accordance with Trust Project guidelines, this price analysis article is for informational purposes only and should not be considered financial or investment advice. BeInCrypto is committed to providing accurate and unbiased reporting, but market conditions are subject to change without notice. Always do your own research and consult a professional before making any financial decision. Please note that our Terms and Conditions, Privacy Policy and Disclaimer have been updated.


![How Naira Failed Me And The Challenge of Building Generational Wealth in Nigeria [video]](https://i1.wp.com/tkcdn.tekedia.com/wp-content/uploads/2025/04/18102950/cv.jpg?w=390&resize=390,220&ssl=1 "How Naira Failed Me And The Challenge of Building Generational Wealth in Nigeria [video]")
